SEM electron backscattered diffraction (EBSD) analysis of cataclastic microstructures
Click on a thumbnail image to see the full sized picture. Use "back" on your browser to come back to this page.

Electron backscattered diffraction (EBSD) in the scanning electron microscope (SEM) permits the accurate determination of the crystal orientation of most minerals. Furthermore, the orientations can be linked to microstructure by using either qualitative orientation contrast (OC) images collected via forescatter (FSE) detectors or quantitative maps constructed from grids of EBSD measurements, with step resolution of <1mm. Thus, statistically significant data sets can be collected from large sample areas. Several commercial computer programs permit control of beam and/or specimen stage movement for collection and indexing of EBSPs, and subsequent data presentation and manipulation. The SEM/EBSD technique has been used here to study grain-scale deformation processes involved in the formation of cataclastic fault rock during faulting to form the Skiag bridge backthrust fault.
For other examples see: optical, SEM, CL, TEM, indentation.
For further details, see: Lloyd and Knipe. 1991, Journal of Structural Geology; Knipe and Lloyd, 1994, Pure and Applied Geophysics 142, 229-254; Lloyd 1987, Mineralogical Magazine 51, 3-19; Lloyd, 2000, Journal of Structural Geology, in press.
SEM electron backscattered diffraction (EBSD) analysis of cataclastic microstructures |
|||
Click on a thumbnail image to see the full sized picture. Use "back" on your browser to come back to this page. |
|||
|
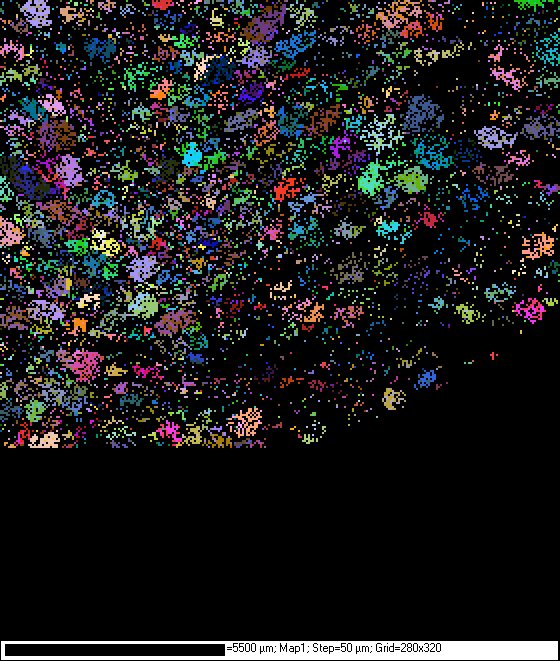
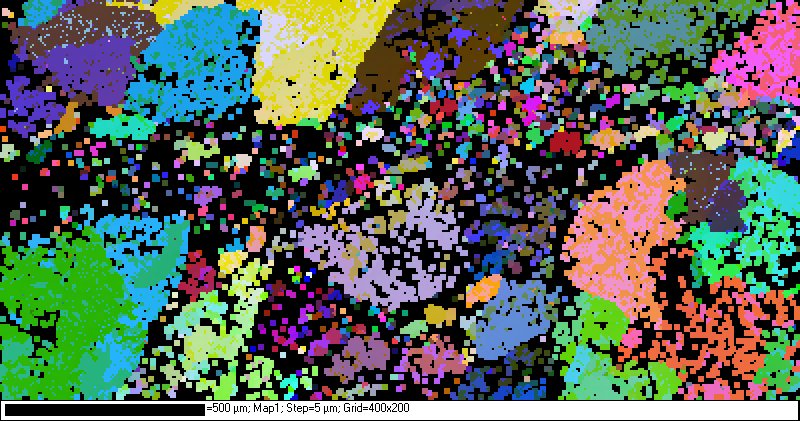
Raw automated (50µm grid step) EBSD image of a whole sample from the hanging wall to the Skiag Bridge backthrust fault, showing mostly undeformed quartzite traversed by two narrow (less than a grain diameter) cataclastic seams. Colours indicate crystal orientation as measured directly by EBSP; black indicates regions of zero EBSP solution. | |
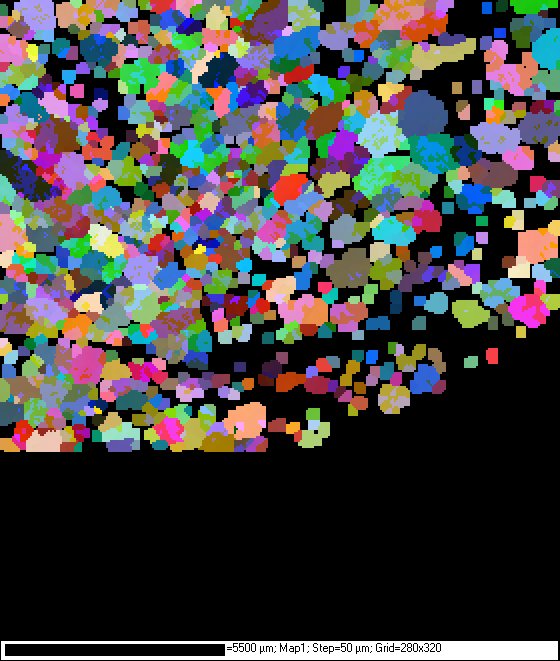
Processed automated EBSD image (1 spike removal, 3 extrapolations) of the whole sample from the hanging wall to the Skiag Bridge backthrust fault, showing mostly undeformed quartzite traversed by two narrow (less than a grain diameter) cataclastic seams. Colours indicate crystal orientation as measured directly by EBSP; black indicates regions of zero EBSP solution. |
|
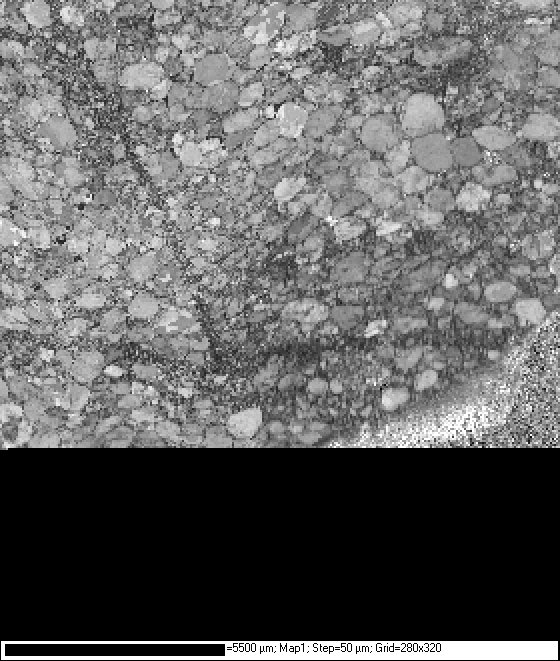
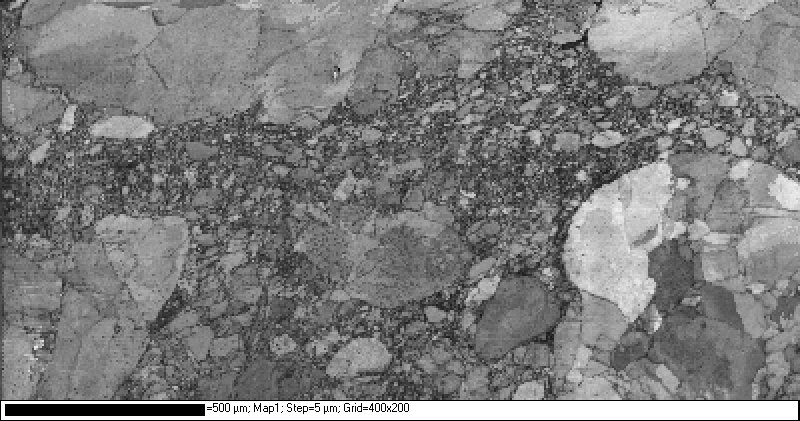
EBSD 'band contrast' image of a whole sample from the hanging wall to the Skiag Bridge backthrust fault, showing mostly undeformed quartzite traversed by two narrow (less than a grain diameter) cataclastic seams. Grey scale indicates the quality of the EBSP (dark, poor; light, good), a qualitative measure of sample strain. | |
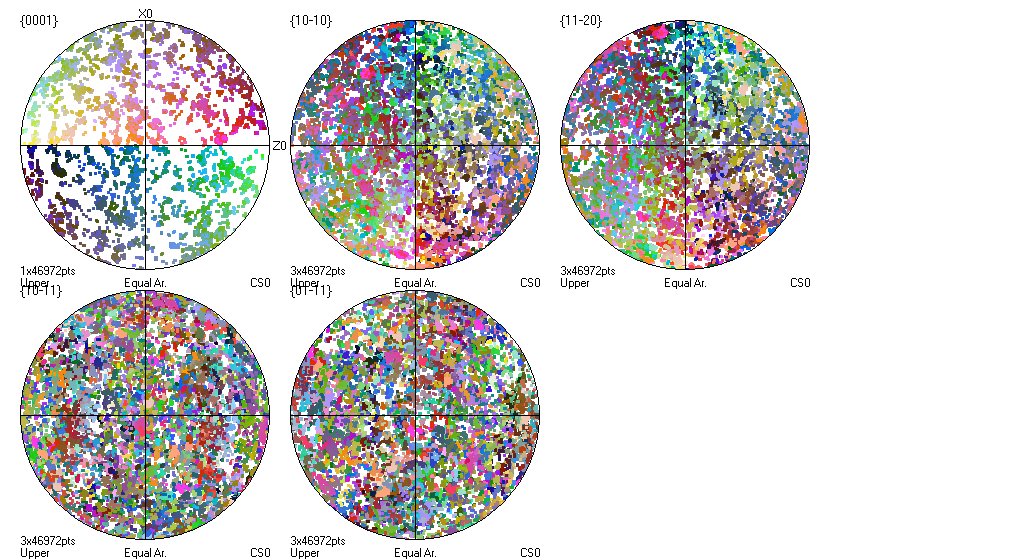
Crystal pole figures of the petrofabric of the quartzite from the hanging wall to the Skiag Bridge backthrust, colour-coded as for automated EBSD images. |
|
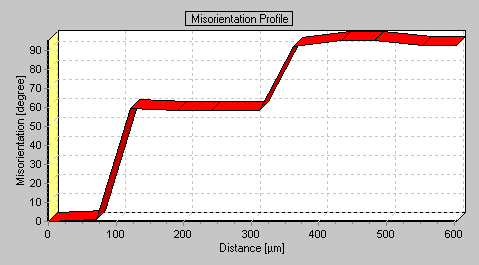
Detail from the automated EBSD image of an individual quartz grain (purple) containing dauphine twins (brown-orange). The line is a short crystal misorientation traverse (see opposite image) from the grain, through a twin, and into the adjacent grain (green). | |
Crystal misorientation (relative to inital orientation) traverse (see image opposite) from parental grain (purple), through a dauphine twin (hence 60° misorientation), into the neighbouring (green) grain (~90° misorientation relative to parent, and 30° relative to twin). |
|
Detail from the automated EBSD image of part of a cataclastic seam and its immediate wall rock (raw image). | |
EBSD 'band contrast' image of part of a cataclastic seam and its immediate wall rock; note fine 'grained' cataclasite and damage in wall rock. |