Institute for Climate and Atmospheric Science
Our research themes

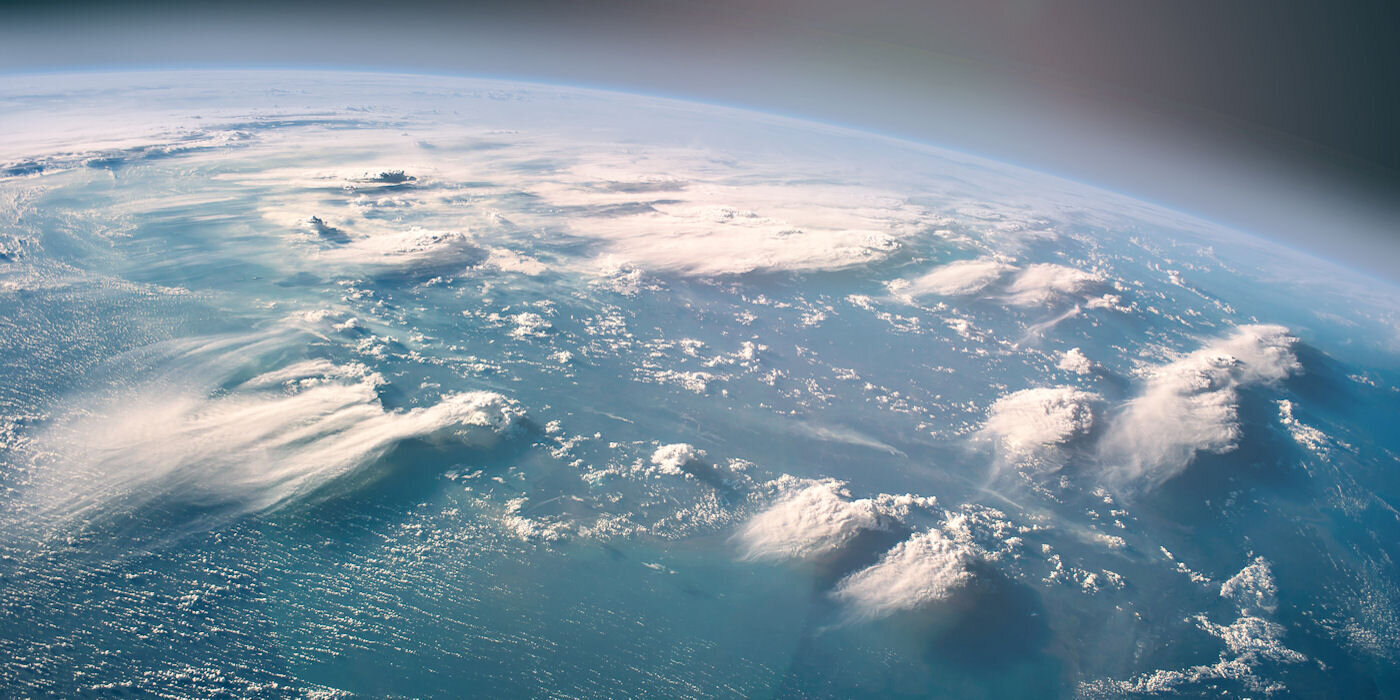
Atmospheric and Cloud Dynamics
We study some of the most important phenomena influencing our weather and climate.
More
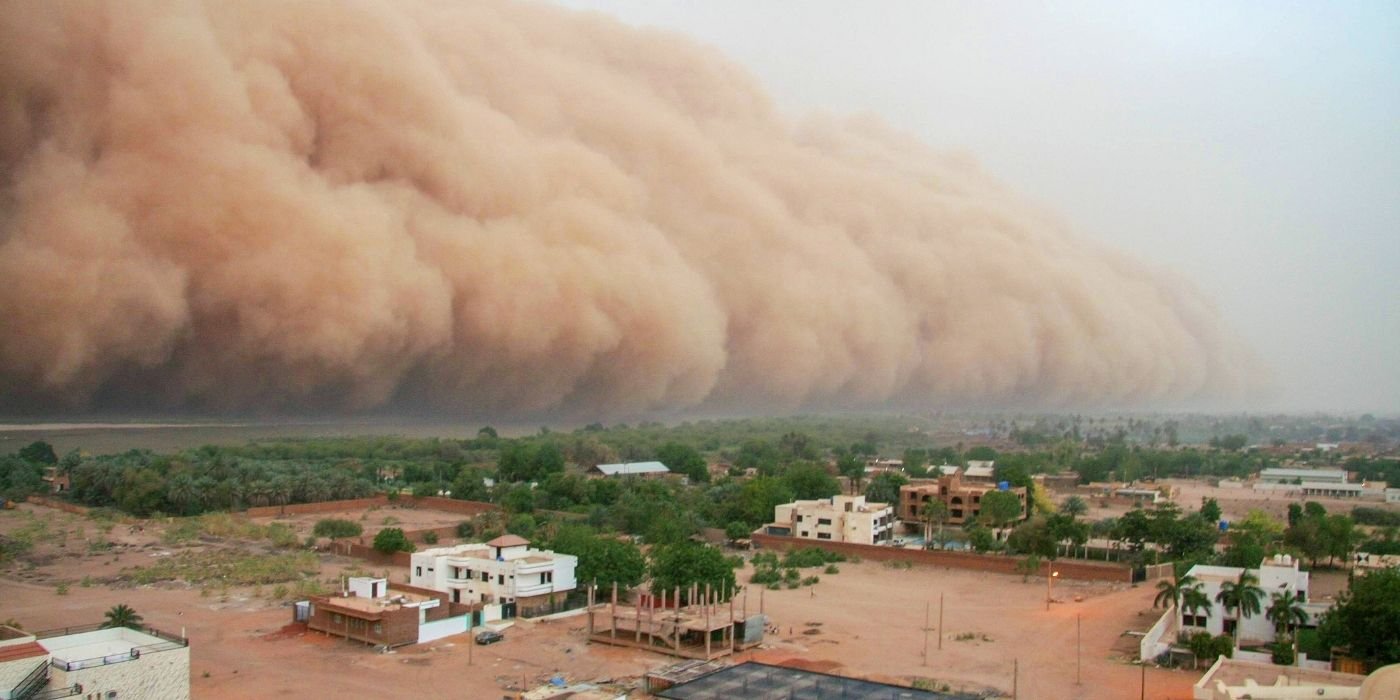
Atmospheric Chemistry and Aerosols
We study the gas phase and aerosol composition of the troposphere and stratosphere.
More
Climate Science and Impacts
We tackle problems with direct societal consequences including melting ice caps, the links between air quality and climate, and food security.
More
Research degrees
Whether you’re looking to begin an academic career or want to develop your skills and expertise for a career in industry, studying for a PhD will be a journey that will stimulate your passion for your subject and push you to reach your potential.
We have PhD opportunities available including a number of scholarships and funded projects.

Attend our seminars
Internal Seminars from our PhD and PDRA researchers and External Seminars from leading atmospheric and climate scientists.
More