Research degrees
Applying for a research degree
How to write a research proposal
Here's how to produce a document that outlines your proposed research topic and programme of research
More
How to apply
Whether you're applying to a project or proposing your own, follow this step-by-step guide to completing your application.
More
Entry requirements
Find out our PhD and MA/MSc Masters by research entry requirements in the School of Earth and Environment.
MoreMy PhD experience

Anya Schlich-Davies
Anya calculates how glaciers and the South Asian monsoon, both vital sources of water among communities, may change in the future as a result of a changing climate.
More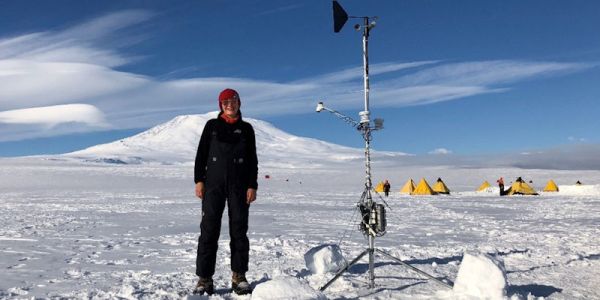
Bryony Freer
Bryony analyses satellite data over the Antarctic ice sheet to gain insight into grounding line migration.
More
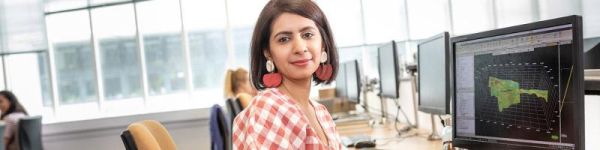
Ashar Aslam
Ashar Aslam is a postgraduate researcher on the Centre for Satellite Data in Environmental Science (SENSE CDT).
More